This is tutorial about Highcharts an amazing javascript and jQuery based plugin which is used to create the graphical charts from passed JSON data, you need to know only the bit of JavaScript and JQuery and you are good to go, read out this simple as a cake tutorial and make yourself familial with this amazing plugin.
Somethimes it is required that we display the methematical numbers in the form of graphs. Fortunately we have a good and easy option available. This is actually a jQuery based tool(I would rather call it a software, it is more than just a plugin), which only need you to provide the data in the form of javascript array. So you can even passon the json encoded data also.
In this example I will take you through the Highcharts basic, which will make you understand how to set up highcharts and how to use make it use on different type of charts. For demonstration purpose we will be using the Bar, line and pie charts which are most commonly known chart types.
In this tutorial I will also place light on a very small but useful concept which may be handy for you. So lets get started. But before we start coding lets know some important points and terminology of the Highcharts. A few key points you must remember before we beign to code are:
- Title and Subtitle: These are very obvious to describe. These are the title and subtitle of chart which tells about what the chart is about.
- Legends: Of course you know about the legend. In the graphs there are graphical representations which are not obvious to know. So legends tell us which is what.
- Axis: There are two axis in any type of graph. x and y axis. but if we are working with 3D graphs there could be another asix, z axis.
- Series: this is the set of data on which we will draw the graph.
- ToolTip: these are the points in graph which describe the value at that perticular point.
So I think we are good to proceed from here on. The HighChart work on the basis of jquery so first of all we will need to include the jQuery in the page where we need to display the high chart. After that we also need to include the highchart.js and exporting.js which are provided in the package you download from highchart.com.
Here is the script we use.
var values = [{
name: 'Number of students',
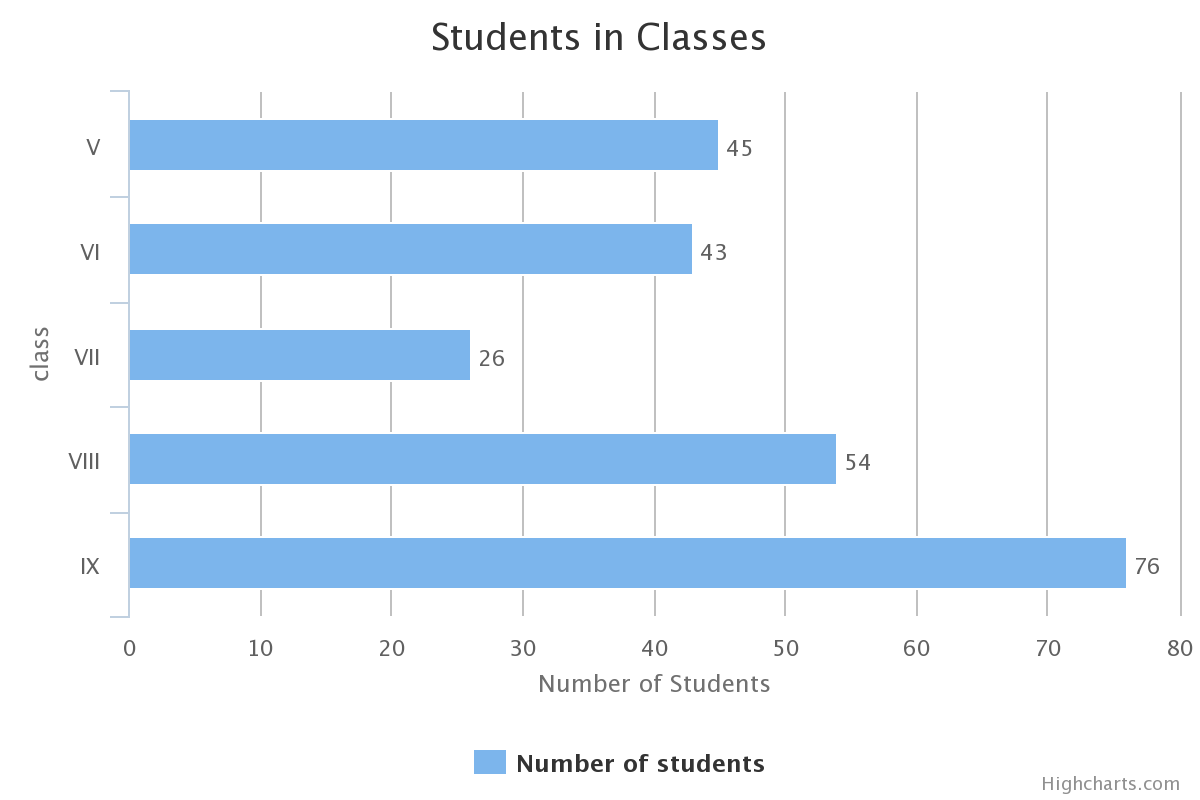
data: [45,43,26,54,76]
}];
function drawChart(seriesValues,chartType){
$('body').highcharts({
chart: {
type: chartType
},
title: {
text: 'Students in Classes',
},
subtitle: {
},
plotOptions: {
series: {
dataLabels:{
enabled:true,
formatter: function(){
return this.y;
}
}
}
},
exporting: {
buttons: {
customButton: {
menuItems: [
{
text: 'Bar',
onclick: function() {
drawChart(seriesValues,'bar');
}
},
{
text: 'Line',
onclick: function() {
drawChart(seriesValues,'line');
}
},
{
text: 'Pie',
onclick: function() {
drawChart(seriesValues,'pie');
}
}
],
symbol: 'triangle'
}
}
},
xAxis: {
title:{
text: 'class'
},
categories: ['V','VI','VII','VIII','IX']
},
yAxis: {
title: {
text: 'Number of Students'
}
},
tooltip: {
formatter: function(){
return 'Number of Students in class '+this.x+' is '+this.y;
}
},
legend: {
layout: 'vertical'
},
series: seriesValues
});
}
$(document).ready(function(){
drawChart(values,'bar');
});
This code is written by taking an example of displaying the numebr of students in few classes. I am trying to demonstrate the use of three chart type. However you will notice there is a flaw in the Pie chart but just to keep the code short I have not resolved. The point is that the Pie chart doesnot uses the second axis. So in this perticular type fo chart x-axis will remain undefined.
When we initialize the highchart we need to specify the container in which the chart is to be drawn. The exporing option is always there to export the chart in a the different picture types. I have created the function drawChart(series,type) which will take the series of data which is to be plotted and with that the type of chart which will decide the chart type.
First of all we have specified the chart title and then chart type.
The plot option is used to specify the points and what will they display. you may keep them disabled by excluding this part and then we can format the string which is to be displayed in on the point mark.
The tooltip is what will be appear when you hover over a point in the graph. we have created a custom script for this purpose.
Exporting is a default menu provided but we have created an extra menu button with the menu items which define the custom callback functions. to change the chart type.
X-axis and Y-axis are passed the parameters to be displayed on the each type of axis. finally the legend is also optional but in case you are plotting multiple type of series it will help.
series is the values in the form of array which will be plotted on the chart. We have created a custom array by the name of value which we pass in the function call to make the plot.
The html is really simple as we have only created body tag and called highchart on it. The complete code looks like this
<html>
	<head>
		<style>
			body{
				width:80%;
				margin: 0 auto;
			}
		</style>
		<script type="text/javascript" src="https://ajax.googleapis.com/ajax/libs/jquery/1.8.2/jquery.min.js"></script>
		<script src="highcharts.js" type="text/javascript"></script>
		<script src="exporting.js" type="text/javascript"></script>
		<script>
			var values = [{
					    name: 'Number of students',
					    data: [45,43,26,54,76]
				}];

			function drawChart(seriesValues,chartType){
			        $('body').highcharts({
				   chart: {
					type: chartType
				    },
			            title: {
			                text: 'Students in Classes',
			            },
			            subtitle: {
			            },
				    plotOptions: {
					series: {
						dataLabels:{
							enabled:true,
							formatter: function(){
								return this.y;
							}
						}
					}
				    },
				    exporting: {
				            buttons: {
				                customButton: {
				                   menuItems: [
                					{
                					    text: 'Bar',
                					    onclick: function() {
                						    drawChart(seriesValues,'bar');
                    						}
                					},
                					{
					                    text: 'Line',
					                    onclick: function() {
					                        drawChart(seriesValues,'line');
					                    }
					                },
							{
					                    text: 'Pie',
					                    onclick: function() {
					                        drawChart(seriesValues,'pie');
					                    }
					                }
					           ],
				                    symbol: 'triangle'
				                }
				            }
			            },
			            xAxis: {
					title:{
						text: 'class'
					},
			                categories: ['V','VI','VII','VIII','IX']
			            },
			            yAxis: {
			                title: {
			                    text: 'Number of Students'
			                }
			            },
			            tooltip: {
					formatter: function(){
							return 'Number of Students in class '+this.x+' is '+this.y;
						}
			            },
			            legend: {
			                layout: 'vertical'
			            },
			            series: seriesValues
			        });
			}
			$(document).ready(function(){
				drawChart(values,'pie');
			});
		</script>
	</head>
	<body>
	</body>
</html>
you can see the live demo here.
You would like to learn more about highchart you can refer to the API documentation which is really good. it will tell you more details. you can access it here. Rather there are so many examples available on the jsfiddle when you want to try them live before implementing.
Pingback: buying enclomiphene uk generic
Pingback: kamagra pas cher pas d'adhésion
Pingback: order androxal retail price
Pingback: buy flexeril cyclobenzaprine united kingdom
Pingback: where to buy cheap dutasteride no prescription
Pingback: how to buy gabapentin generic online cheapest
Pingback: how to buy itraconazole generic next day delivery
Pingback: discount fildena canada
Pingback: staxyn order online no membership overnight
Pingback: cheap avodart low cost
Pingback: online order rifaximin uk cheap purchase buy
Pingback: canadian pharmacy xifaxan pills 100 mg
Pingback: opravdu generic kamagra opravdu funguje